Food Cost & Menu Performance

The restaurant analytics dashboard built for food cost control

See food cost %, view purchasing insights, and analyze menu performance across every location — updated automatically as ingredient prices change. meez bridges the gap between your culinary team and your bottom line.
Chef stirring a pan and a chart showing invoice cost categories
Take a quick product tour

What a restaurant analytics dashboard should actually show you

Your POS tracks what sold. Your accounting software tracks what you spent. Neither tells you why your food costs are what they are. meez fills that gap.

Green check
Real-time food cost %
and menu performance
Green check
Recipe costs update when
ingredient prices change
Green check
No spreadsheets, no lag,
no surprises on the P&L

Lower theoretical food costs and increase profitability

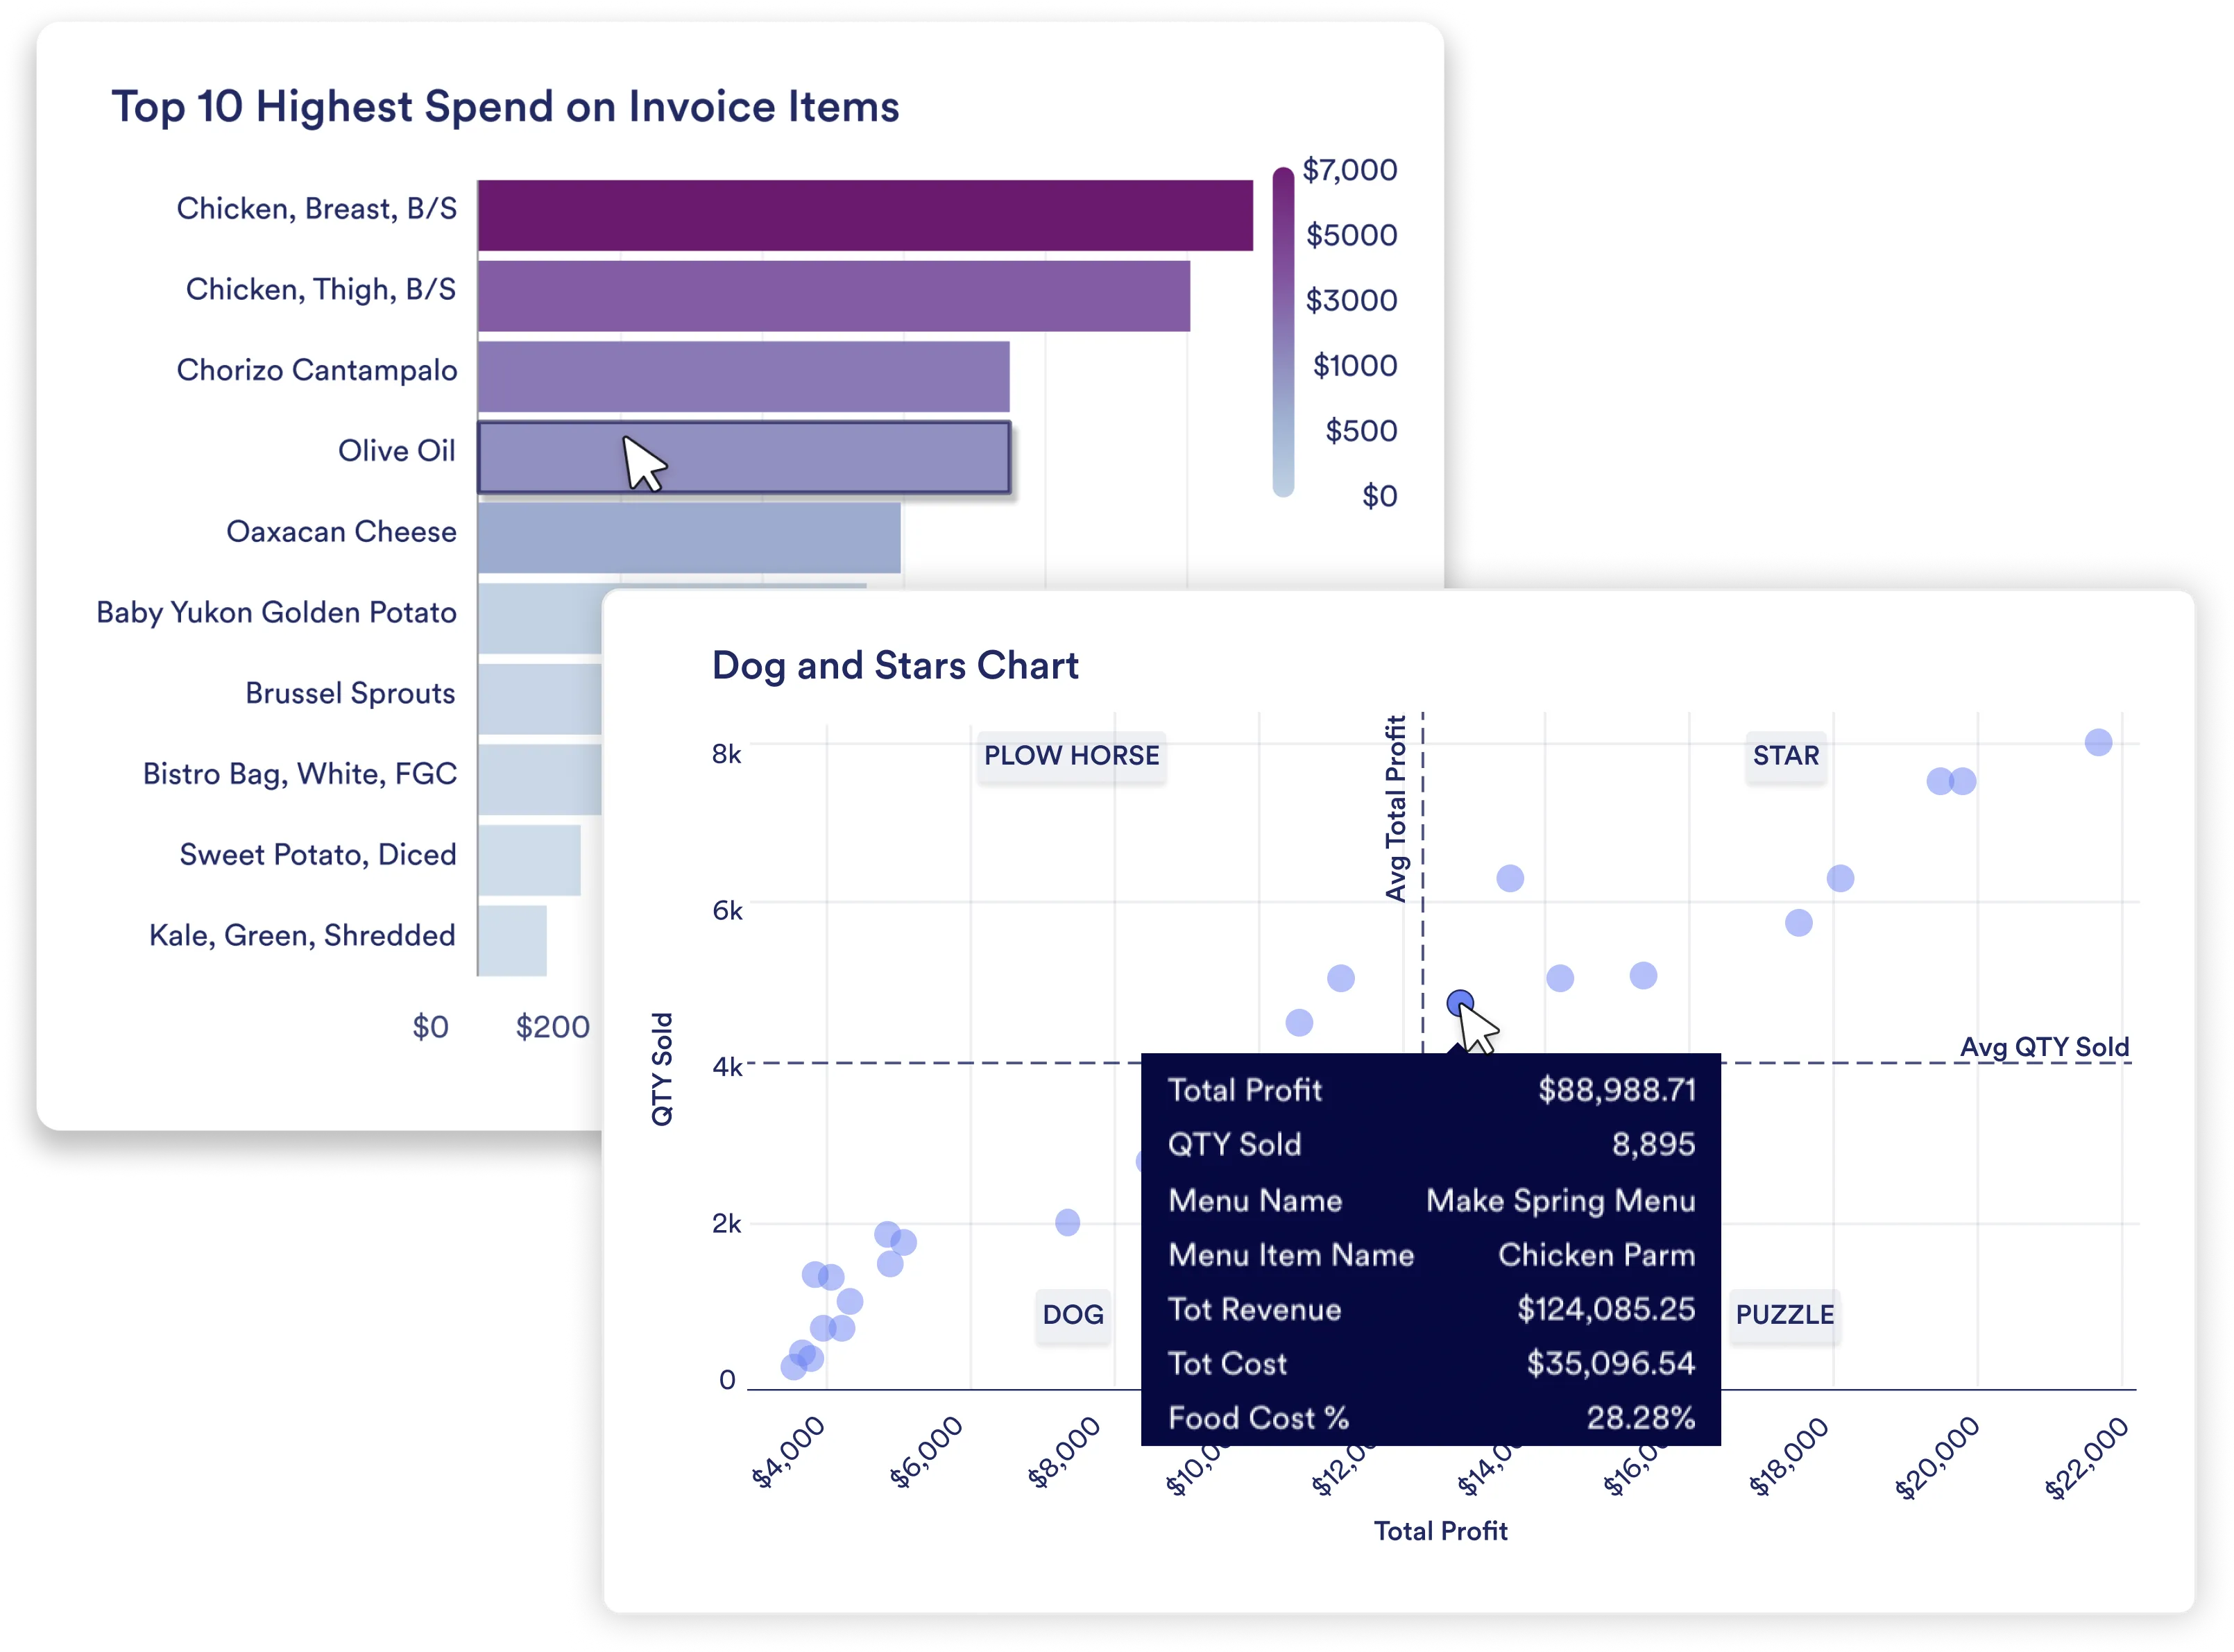
Harness the power of menu analytics with our comprehensive dashboard. Easily identify areas for improvement using our intuitive charts and graphs.

  • Uncover your highest and lowest profit-driving menu items
  • Track your most and least popular dishes with menu analytics
  • Highlight sleeper menu items and boost profits

meez
meez

Menu analytics that drive profitable decisions

Knowing your overall food cost % is a starting point, not an answer. meez lets you sort your entire menu by revenue, gross profit, and menu cost %. 

  • See exactly which dishes are working and which are dragging you down
  • Model a price change, swap an ingredient, or adjust a portion size
  • Make proactive decisions by analyzing impact on margin before you commit
yellow outline shape

Identify hidden cost drivers

A significant portion of your food costs often comes from a small number of key ingredients. Our menu analytics app provides valuable purchasing insights, helping you identify and manage costs with ease to optimize spending.

  • Spot your highest usage ingredients
  • Focus on waste management
  • Optimize purchasing decisions
  • Simplify inventory management
plating oysters with food costing product images

Built as a restaurant analytics app, not a spreadsheet

Spreadsheets break at scale. They require manual updates and can't account for real prep yields or unit conversions. meez structures your cost data from the start. 

  • Recipe costs update automatically via your existing integrations 
  • The dashboard is accessible on any device, by anyone on your team. 
  • Save 4–5 hours a week that used to go toward manual costing

Monitor price volatility over time

Stay ahead of the game with our menu analytics software. Monitor price fluctuations and optimize purchasing to ensure you're always getting the best value.

  • See how price changes impact overall menu costs
  • Avoid surprises by tracking volatile ingredient costs over time
  • Refine recipes with cost-effective ingredients
plating oysters with food costing product images

Your multi-location restaurant dashboard

Benchmark locations against each other. Drill to the recipe level when a number looks off. Even a 1-point food cost improvement across 10 locations can mean hundreds of thousands of dollars recovered annually.

  • Filter performance by location, concept, or time period.
  • Keep your recipe library version-controlled across every location
  • When you push an update, it goes everywhere simultaneously

Frequently Asked Questions

What is a restaurant analytics dashboard?

How is a restaurant analytics app different from a POS or accounting system?

Can I use meez as a restaurant dashboard for multiple locations?

What metrics does meez's restaurant analytics dashboard track?